
ZDM of CP stars : a highway to
perdition
contradicting O.
Kochukhov and N. Piskunov (from A-Z)

All the problems in magnetic and abundance mapping of CP stars really
started in 2002 (A&A 388, 868) when O. Kochukhov and N.
Piskunov claimed :
"Our Doppler Imaging code [INVERS10] is successful in the simultaneous
recovery of fairly complex magnetic and abundance distributions" and when
they subsequently stated : "We believe that the code can be successfully
applied to the imaging of global stellar magnetic fields and abundance
distributions of an arbitrary complexity."
An overly tolerant referee accepted these statements although the
"fairly
complex" magnetic distributions consisted of simple dipole + quadrupole
field geometries with field strengths much larger than those found in many
CP stars -- among them the repeatedly (2002, 2010, 2014) analysed star
α2CVn. The big-hearted referee also did not mind that
the "fairly complex"
abundance distributions consisted either of a single largish, high-contrast
monolithic spot (i.e. with constant abundance over the whole extension of
the spot) or of 3 largish, high-contrast monolithic spots, evenly
distributed in longitude over the stellar surface.
Kochukhov & Piskunov even managed to successfully place the
claim : "The
average error of the abundance recovery was 8% (which corresponds to only
0.04 in log(N_Fe/N_total) units)" although their own plots (Figs. 3, 5, 9,
12) clearly show that abundances for the recovered spot(s) may be in error
by 0.5 dex and more ! Of course these BW plots make it somewhat difficult
to arrive at highly accurate error estimates but one is immediately struck
by the difference between the grey, washed-out spots as recovered and the
deep black originals. Why not have a look at page 39 of the presentation
by O. Kochukhov "Surface cartography of the Sun and stars" (Besancon, 2014)
or take Figs. 3-4 of Kochukhov (A&A 597, A58, 2017) where the error range
is found to be in excess of 1 dex ? Somehow it must have escaped the
referee by which means Kochukhov & Piskunov arrived at a mean mapping
accuracy of 0.04 dex : choosing the exact background abundance and having
to deal only with the adopted single spot which covers a very small
percentage of the stellar surface, they could easily bring down the large
errors attached to a considerable number of pixels in and near the spot to
an almost negligible mean global error. We are faced with an imaginative
but completely meaningless approach to statistics in the ZDM context.
Probably the referee has overlooked the fact that the belief in the power
of the ZDM code is firmly based on a test which is utterly remarkable for
its singular artificiality. Kochukhov & Piskunov (2002) leave no doubt :
"We have chosen the rotational velocity v sin i = 30 km s−1
and inclination
angle i = 60 deg, which
are optimal for DI." They add :
"The reference
magnetic topology of our DI tests consisted of a dipole with polar strength
Bd = 8 kG, positioned in the plane of the stellar rotational equator, and
with the positive magnetic pole crossing the plane containing the line-of-
sight and the stellar rotational axis at zero phase ... Such a
magnetic
geometry, rotational velocity and inclination collaborate to maximize the
magnetic variability of the spectral line profiles and
represent an ideal
combination for the application of MDI." For the high-contrast spot(s)
Kochukhov & Piskunov specify :
"We used an iron abundance ε(Fe) =
log (N_Fe/N_total) = −4.0 outside
spots and ε(Fe) = −2.5 inside iron
concentrations."
Once the belief in the extraordinary, but unproven capabilities of ZDM
had been accepted by A&A nothing could stop the users of the INVERS family
of codes over the next decades to apply their analysis to every possible
CP star and to publish the most extravagant magnetic maps, such as those of
HD32633 (Silvester et al., 2015, MNRAS 453, 2163, 17 kG maximum field) and
of HD125248 (Rusomarov et al. 2016, A&A 588, A138, 11 kG maximum field).
Both stars are credited with magnetic geometries featuring large areas
of almost zero magnetic field in contradiction with the largely dipolar
orientations of the field lines. Abundance structures have been published
with respective contrasts as low as 0.6 dex in Fe, of 0.6 in Co, 0.7 in Ti,
0.5 in Y, or even 0.4 in Ce (Lüftinger et al., HD24712, A&A 509, A71,
2010), 0.5 in Ni (Lüftinger et al., HD50773, A&A 509, A43, 2010). On
the other hand, contrasts of up to a staggering 7 dex between minuscule
over-abundance spots and closely neighbouring under-abundance spots have
been published for HR3831 (see the Ba maps in Fig. 10 of Kochukhov et al.,
A&A 424, 935, 2004).
Meanwhile it has been amply proven that ill-founded assumptions, gross
errors, serious contradictions and blatant violations of the basic laws of
stellar astrophysics are pervading the DM and ZDM literature. Several of
these points have already been discussed in various refereed journals, in
conference proceedings and on specialised web-pages, but the world is still
waiting for a reasonably complete critique of all the objectionable aspects
of ZDM. In the following I shall attempt to provide such a review. It is
difficult, if not impossible, to present the salient charges in order of
importance, so the reader may pardon me if I simply write down my arguments
as I peruse and digest the relevant literature in the light of well
established theoretical astrophysics and my own work over the last decades.
Some readers might also be surprised that sometimes I will indicate how
an analysis ought to have been carried out in order to be self-consistent,
notwithstanding the fact that the whole approach would still be violating
basic physics.
Index:
 a) Un "paradis artificiel"
 b) What Kochukhov and coworkers claim to have found in real Cp stars
 c) HR 3831 vs. "artificial paradise"
 d) Most magnetic maps are spurious, either leading to div B ≠ 0
or violating
the force-free condition
 e) Redefining the meaning of the word “confirm“
 f) New data → new maps forever ?
 g) Same element, same data set, same code
→
different spots, different overall contrast
 h) Ignoring the magnetic field of a spotless star
 i) Ignoring the magnetic field of a "paradisiacal" spotted star
 j) No spurious spots produced when mean atmospheres are used ?
 k) Beware of LSD
 l) LSD based ZDM : a very special single-line inversion
 m) LSD and ZDM : increasing the number of lines, does it help ?
 n) LSD based ZDM : worse than usual single-line inversions
 o) "Noise mapping" of HD50773
 p) An exercise in futility
 q) Magnetic maps and magnetic pressure
 r) Horizontal equilibrium ?
 s) The spots in HD3980 from a terrestrial perspective
 t) It can become even weirder !
 u) Unphysical regularisation functions
 v) Equilibrium solutions and pseudo-rings
 w) Time-dependent atomic diffusion and mass loss
 x) Do spots and magnetic features really rotate differentially ?
 y) Spatial super-resolution with Invers10 ?
 z) Conclusions
a) Un paradis artificiel
In A&A 597, A58 (2017) O. Kochukhov is essentially repeating some of
the tests carried out together with N. Piskunov in 2002 (see above).
We are confronted with what could be called an "artificial paradise".
The test star obliges with optimum stellar parameters, simplistic
magnetic geometry and uncannily well-placed identical high-contrast
spots of elaborately simple horizontal structure.
As in 2002, "the adopted v sin i [40 km s-1]
and i [60 deg] are in
the middle of, a relatively wide, range
optimal for DI." Interestingly
enough, the magnetic field geometry proves devoid of the slightest hint
at complexity, even less than back in 2002 : "The star was assumed to
have a dipolar magnetic field topology with a polar field strength
of 2.5 kG and 90 deg inclination of the magnetic field axis relative to
the rotational axis." In a breathtakingly artificial scenario -- not
found in any Ap star -- 4 perfectly circular, high-contrast (1.5 dex)
spots are distributed at exactly spaced longitudes of 90 deg, and
"placed at the latitudes of −30, 0, 30, and 60 deg". All
the 4 largish
spots exhibit absolutely identical structures (umbra + penumbra) and
radii : "We adopted the inner spot radius
of r_in = 15 deg and the
outer radius of r_out = 30 deg".
It is worthwhile pointing out a fact not mentioned at all by Kochukhov:
the spots have been most carefully placed in such a way as to avoid
the magnetic poles [compare Fig. 1 with Fig. 3] -- something that is
of considerable importance when it comes to magnetic intensification
and zero field inversions.
b)
What Kochukhov and coworkers claim to have found in real CP stars
No attempt at all has been made to have a look at parameters and
magnetic geometries claimed to have been found by means of ZDM in
these stars
v sin
i i
49 Cam 23
120 Silvester et al. MNRAS 471, 962, 2017
0 kG < |B| < 6.5 kG
extremely patchy magnetic field
field horizontal at sharp field maximum
irregular "spots" of Ca, Sc, Ce, Pr, Nd,
Eu
53 Cam 12.5
57 Kochukhov et al. A&A 414, 613, 2004
field patchy, 4 kG < |B| < 26 kG,
small, irregular Fe "spots"
α2CVn 18.0
120 Silvester et al. MNRAS 440,
182, 2014
0.1 < |B| < 4.9 kG
extremely patchy magnetic field
huge horizontal field gradients
CU Vir 145
46 Kochukhov et al. A&A 565, A83, 2014
0.07 < |B| < 3.98 kG
field modulus becomes zero where field
changes polarity
very patchy Si and Fe maps
HD3980 22.5 60
Nesvacil et al. A&A 537, A151, 2012
extremely high-contrast "spots" of Li, O,
Mn, Pr, Nd
at the magnetic poles
HD24712 5.6 137
Lüftinger et al. A&A 509, A71, 2010
very low contrast for Ti, Fe, Co, Y, Ce
HD32633 18.0
80 Silvester et al. MNRAS 453, 2163, 2015
field very patchy, 0 kG < |B| < 17
kG
high-contrast irregular "spots" of Mg,
Si, Ti
HD75049 11.5
25-31 Kochukhov et al. A&A 574, A79, 2015
extreme field strengths of up to 40 kG
large horizontal field where |B| is
strongest
HD119419 27
60 Rusomarov et al. A&A 609, A88, 2018
2.28 < |B| < 26.35 kG
polar patch of very weak field
irregular and patchy maps of Fe, Cr, Nd,
Ti
HD125248 11.5
75 Rusomarov et al. A&A 588, A138,
2016
0.14 kG < |B| < 11.16
horizontal field strongest where |B| is
strongest
but field direction would point towards
magnetic pole
irregular "spots" of Fe, Ce
c)
HR 3831 vs. "artificial paradise"
Quote Kochukhov & Piskunov (A&A 388, 868, 2002) :
"The abundance distribution, adopted for these experiments, was more complex
than the single-spot map of the reference test [their
Fig. 3] and consisted
of the three areas of an enhanced iron abundance located at latitudes 0◦ and
60◦ and equidistantly spaced in longitudes [their
Fig. 5]."
"Then inversions were repeated for the same magnetic geometries, but now with
the more complex abundance distribution, consisting of three spots of
iron over-abundance located at different latitudes. This second series of
tests is probably the most representative of the actual surface structures
on a substantial fraction of magnetic CP stars."
Just 2 years later, in their analysis of HR 3831 (HD 83368), Kochukhov et al.
(A&A 424, 935, 2004) however present maps of 17 chemical elements, derived
by means of non-magnetic Doppler mapping, which often bear little or no
resemblance to the "paradis artificiel" of 2002.
Quote Kochukhov et al. :
"Our study represents the most thorough examination of the surface
chemical structure in a magnetic Ap star and provides important
observational constraints for modelling radiative diffusion in magnetic
stars. The exceedingly high quality of some of our spectroscopic data
allowed us to reconstruct unprecedented details of abundance distributions,
demonstrating a high level of complexity in the surface structure down
to the resolution limit of the Doppler maps."
Indeed, the "high complexity level" visible in their Fig. 10 flatly contradicts
the assumptions made in 2002. The Fe map is devoid of any neatly structured
and distributed spots, the Nd map is characterised by over-abundances over a
large portion of the stellar surface, Ca is enhanced along a section of the
presumed magnetic equator, but also in elongated "spots" Increased oxygen
abundances are found in what resembles a belt aligned with the magnetic
equator, Si enhancements cover a large stretch south of the stellar rotational
equator.
No numerical tests have so far validated these results.
One could have expected Kochukhov to expand the numerical tests and to apply
them to abundance maps similar to those published by himself over a span of
15 years. Instead, in his "artificial paradise" paper, Kochukhov sticks to
a simplistic abundance distributions based on 4 perfectly symmetric spots of
identical size, ideally arranged in longitude and latitude.
Quote Kochukhov (A&A 597, A58, 2017) :
"This multiple [4] spot
configuration is more complex than the 3-spot
abundance map previously considered in the numerical tests of Invers10
(Kochukhov & Piskunov 2002)."
Even though the "complexity" of Kochukhov's tests apparently increases all
the time, it never reaches even in the most approximate of ways the "high
level of complexity" and the "unprecedented details" of the HR3831 Fe map
or of the Fe map of CU Vir (Fig. 13 in Kochukhov et al. A&A, 565, A83, 2014).
d)
Most magnetic maps are spurious, either leading to div B ≠ 0
or violating the force-free condition
Maps (co)published by Kochukhov exhibit field contrasts of up to 80 and
higher, in conjunction however with largely dipolar field directions !!
53 Cam
(2008)
1.4 – 26.1 kG
α2CVn
(2014)
0.1 – 4.9 kG
HD32633
(2015) 0.0 –
17.0 kG
HD125248
(2016) 0.14 – 11.16 kG
Funnily enough, Kochukhov et al. (2012) have attacked Stift et al.
(2012) because of their assumed field contrast.
Quote Kochukhov :
“The unspecified “eccentric dipole” with an unusually high contrast
(field strength variation by a factor of 3.7 instead of a factor of
2 expected for a centred dipole) seems to have been hand-picked to
maximise profile differences."
The huge field contrasts claimed by Kochukhov et al. (2004) might
possibly have to be revised. Quote Kochukhov :
"Evaluating Eq. (15) we obtain a net flux over the visible surface of
53 Cam of −1.63 × 10²⁰ kG m2, as compared to a net unsigned flux of
3.73 × 10²⁰ kG m2. This is a very large flux imbalance (44% of the
total possible flux). Note that for test dipoles sampled on the same
grid and analysed simultaneously with the same tools, we find a net
flux imbalance of less than 0.2%. Thus, it appears that the MDI map
of 53 Cam does not satisfy Eq. (15) [i.e. no zero divergence]."
As for the force-free condition neglected by Kochukhov &
Piskunov see
my adventures with the ApJ and the
article by Stift & Leone in
A&A
e)
Redefining the meaning of the word "confirm"
In the context of the mapping of HD24712 the following abundance
contrasts have been claimed :
Lüftinger et al. (A&A 2010) Nd III
1.1 dex
Rusomarov et al. (A&A 2015) Nd III
2.6 dex (text)
~ 3.2 dex (contours in plot)
Not only is there this strange increase (by how much exactly?) in
contrast, the spot even changes position !!
Quote Rusomarov (A&A 2015) :
“The new maps confirm the previous
findings, and also show some details not present in the previous study.”
May my
scientific results be spared this kind of confirmation !!!!
f)
New data → new maps forever
Looking at the analyses of
α2CVn in 2002, 2010 and 2014, one notes huge
changes in abundance contrasts. Ap stars are known to be very stable,
so it must be the data (and the method), not the star, that are
responsible for widely differing results.
The following Fe contrasts have been claimed :
-2.1 -4.4 Kochukhov et al. (2002)
-1.5 -6.4 Kochukhov & Wade (2010)
-2.0 -5.5 Silvester et al. (2014)
The following Si contrasts have been claimed :
-3.0 -5.4 Kochukhov et al. (2002)
-2.0 -6.0 Silvester et al. (2014)
The following Ti contrasts have been claimed :
-4.5 -6.3 Kochukhov et al. (2002)
-4.0 -8.0 Silvester et al. (2014)
The following Cl contrasts have been claimed :
-1.8 -5.7 Kochukhov et al. (2002)
-3.0 -6.0 Silvester et al. (2014)
Magnetic maps of α2CVn throughout the years :
0.3 – 4.3 kG “Magnetic Stars”, 2004
1.0 – 4.3 kG IAUS 224, 2004
0.0 – 4.4 kG Skalnate Pleso, Vol. 35, 2005
0.6 – 3.1 kG Solar Polarization 4, ASP Conf. Series 358, 2006
0.1 – 4.9 kG IAUS 302, 2013
Changes occur on very short notice !
g) Same elements,
same data set, same code
→
different spots, different overall contrast
There exists just 1 spectropolarimetric data set for 53 Cam. Only
1 code (INVERS) has been applied to these data. Strangely enough,
spots appear and disappear between 2004 and 2008, accompanied by
changing contrast of abundance features, whereas the magnetic field
map remains largely the same.
Kochukhov (http://www.astro.uu.se/~oleg/) :
Δε(Si) = 3.4 dex
high-contrast belt
Δε(Fe) = 4.0 dex
high contrast southern Fe
spots (-30o
and -45o)
no south polar Fe spot
Piskunov (Phys.Scr. 2008) :
Δε(Si) = 4.3 dex
low-contrast belt plus
high-contrast spot(s)
Δε(Fe) = 5.0 dex
Extreme south polar Fe spot
([Fe/H] = -1.4) !!
When one compares the spectral resolution to the rotational Doppler
shift, one is stunned by the resulting high spatial resolution of
the abundance structures as plotted in Fig. 4 of Piskunov (2008) and
in http://www.astro.uu.se/~oleg/images/53cam_abn.jpg:
R = 35000
→ 140 mÅ
vsini = 12.5 kms-1 → +/- 208 mÅ
53 Cam is not the only star whose maps derived from exactly the same
set of observations and with the same set of codes including INVERS12,
LLmodels and Synth3 have been substantially revised. A fascinating
example -- non-magnetic DM of HD3980 -- is provided by Obbrugger,
Lüftinger, Nesvacil, Kochukhov and Weiss (Contrib. Astron. Obs.
Skalnaté Pleso 38, 347, 2008) and by Nesvacil, Lüftinger, Shulyak,
Obbrugger, Weiss, Drake, Hubrig, Ryabchikova, Kochukhov, Piskunov
and Polosukhina (A&A 537, A151, 2012).
Comparing the 2008 Li, Pr, Gd, Fe, and Cr maps with those
published just 4 years later we see that the Li blend previously
seemed to indicate abundances ranging from -9.5 to -2.5, but that
in 2012 this became -10.0 to -4.0. Please note at this point that
in both papers the Li maps have consistently been derived without
taking into account the Paschen-Back effect, not even any magnetic
field. With the DM analysis in 2012 still based on a mere 2 Fe and
4 Cr lines (2 of the latter blended,) Fe and Cr abundances were
claimed to range between -5.3 and -2.3, whereas in 2008 they went
from -6.0 to -1.5 and from -7.0 to -1.5 respectively.
One would certainly like to know what causes the Pr spots -- based
on a single line blended with Fe and Gd -- to expand in such a
spectacular way. Why is the 2008 map of Cr distorted almost beyond
recognition in the 2012 map for several phases? No explanation for
this can be found in Nesvacil et al. (2012). Is it due to a different
choice of lines (but without an increase in their number) ? Is it
perhaps due to observations used in 2008 but omitted in the 2012
analysis ? We'll probably never know.
h)
Ignoring the magnetic field of a spotless star
What happens when one neglects magnetic fields in the inversion process ?
Many of the stars for which abundance maps have been derived harbour
magnetic fields of several kG strength.
Magnetic intensification will play an important role but its repercussion
on non-magnetic abundance maps are almost impossible to predict without
detailed simulations. The maps of the following stars might be affected :
HD3980
HD50773
HD83368
On the other hand, a forward spectral line synthesis based on the
published maps will immediately reveal the effect of the magnetic
field: simply compare the non-magnetic spectra to the magnetic spectra
(see the HD3980 example published in Figs. 5 and 7 of Stift & Leone,
MNRAS 465, 2880, 2017).
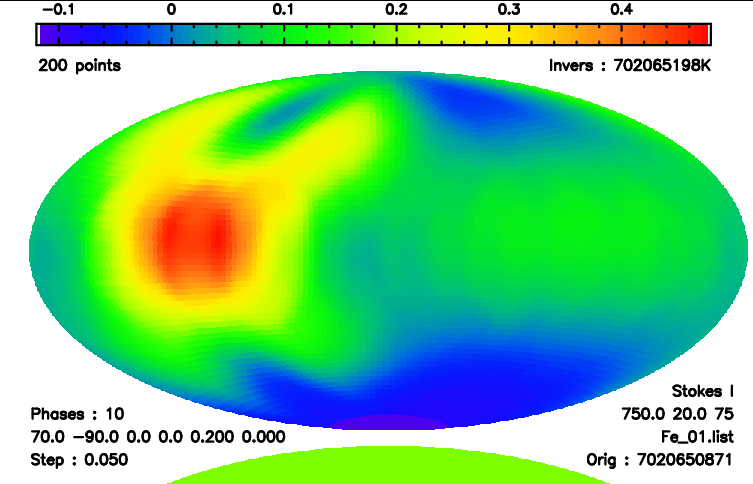
The problem of zero-field Doppler mapping has been quantified by Stift
already in 1996 (IAU Symp. 176 "Stellar Surface Structure", pp. 61-68).
In his invited talk Stift shewed [archaic !] that zero field DM inversions
will yield spurious abundance maps of non-negligible contrast, even when
magnetic field strengths are fairly moderate.
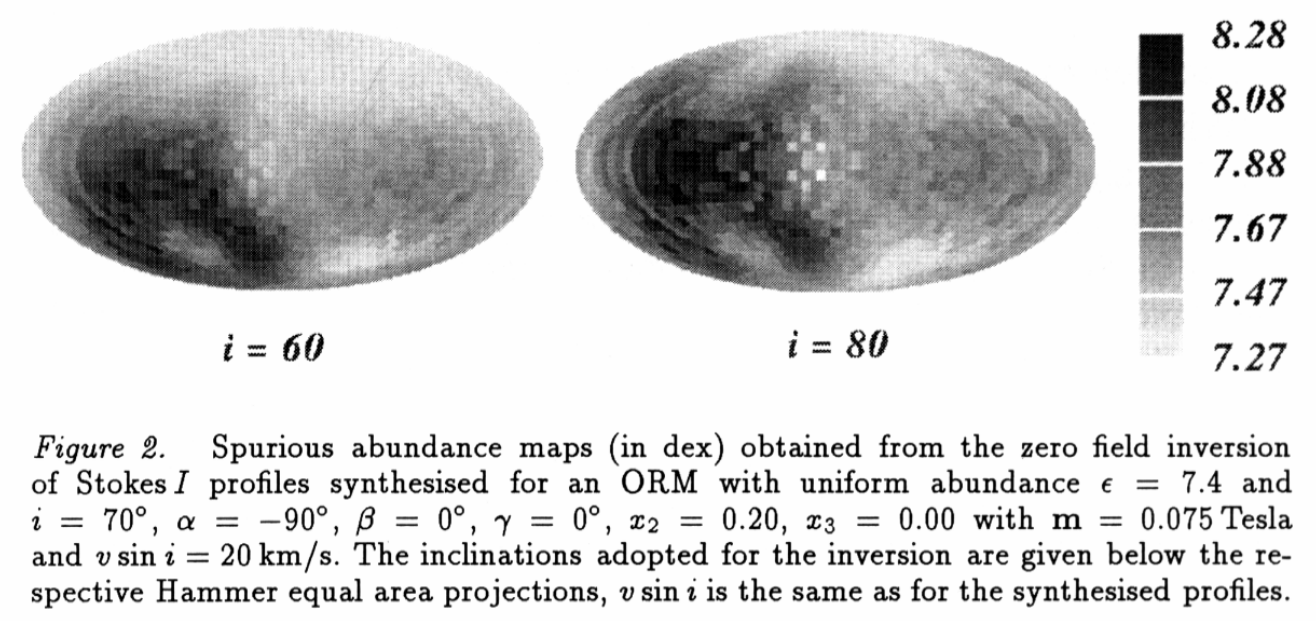
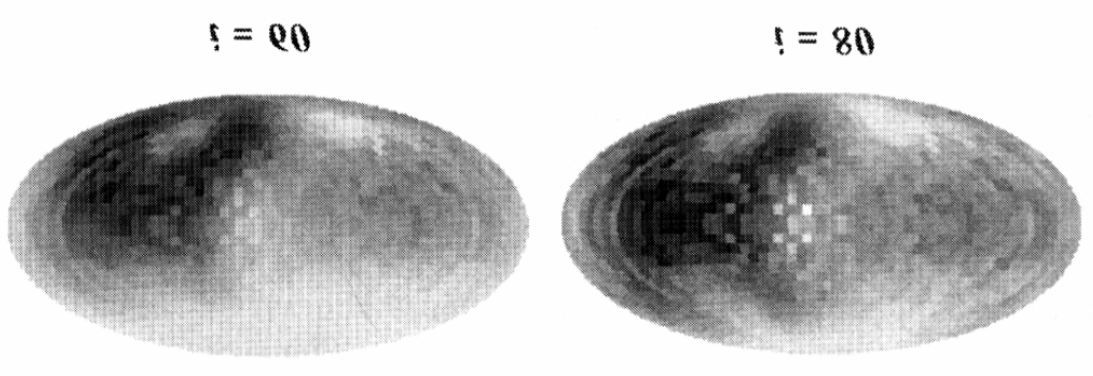
20 years later : resolution is much higher, the smoothing algorithm vastly
improved, still the results turn out identical.

i)
Ignoring the magnetic field of a "paradisaical" spotted star
Quote (Kochukhov 2016):
"Ignoring a moderately strong, 2.5 kG dipolar
magnetic field in abundance DI introduces a mean offset of about 0.3 dex
in the recovered chemical maps. The average relative reconstruction
errors increase to ∼0.2 dex while the maximum relative errors reach
∼0.3 dex. These errors correspond to distortions of real surface
abundance inhomogeneities. The spurious component of abundance maps
(i.e. Zeeman broadening and intensification misinterpreted as abundance
variations) does not exceed ∼0.15 dex on average."
This is a result which applies exclusively to the "artificial
paradise" considered by Kochukhov. Such a result cannot be
generalised, being not even valid for exactly the same spot
configuration, once the direction of the dipole axis (longitude
and/or latitude of the magnetic pole) is changed !!!
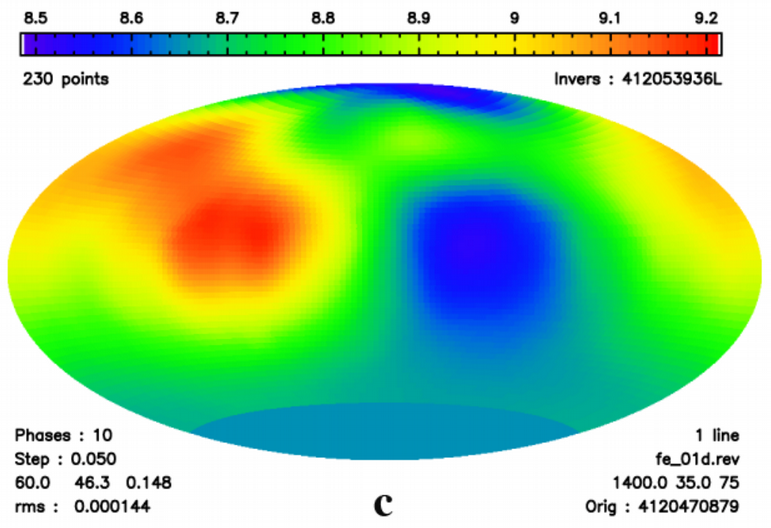
If one carries out a zero-field inversion of a star with a non-axisymmetric
field (geometry identical to that of HD 154708) and no spots, everything
starts to look quite different.
Here the spurious component is
about 8 times
larger,
reaching 1.2 dex !!
j)
No spurious spots produced when mean atmospheres are used ?
Take a star with 3 structured large spots well distributed in longitude
and latitude, now featuring both over- and under-abundances; “true”
local atmospheres are used in the spectral synthesis. When a mean
atmosphere is taken for the inversion, 1 spot is not recovered at all,
the under-abundances are under-estimated, and a spurious structure
appears near the north pole.
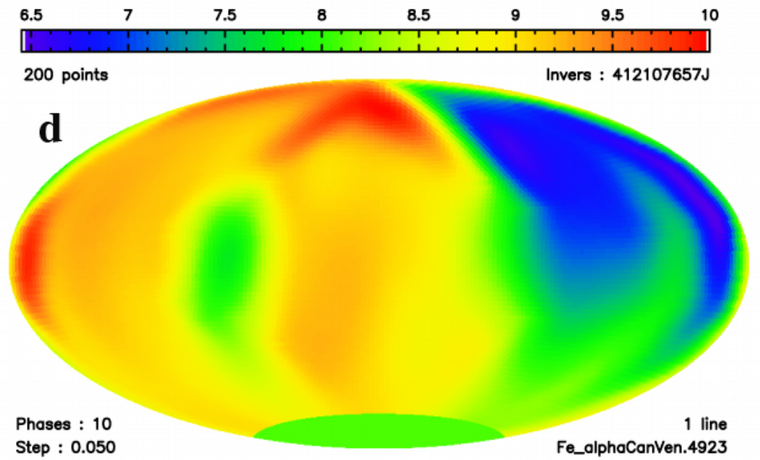
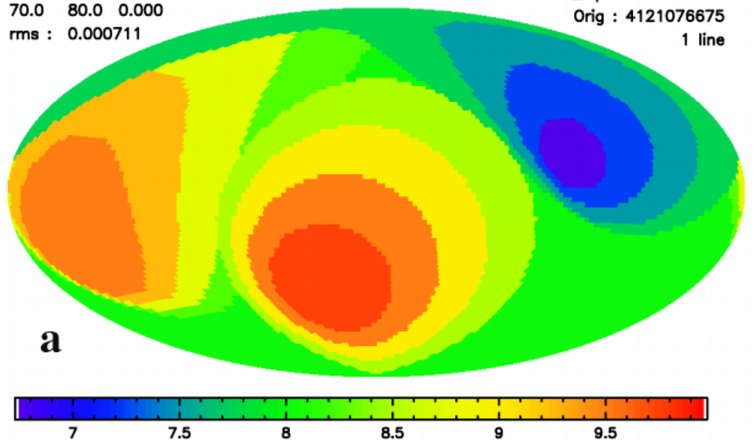
Quote (Kochukhov 2016):
"Ignoring local atmospheric structure
variations leads to average reconstruction errors of ~0.2 dex and
maximum errors of ~0.3 dex. These numbers correspond to the effect
of overabundance spots of the element (iron) providing the most
important contribution to the atmospheric opacity ... no spurious
spots are produced".
This again is a result valid exclusively for the "artificial
paradise" created by Kochukhov -- i.e. for precisely the
positions and contrasts of the spots and for the precise
orientation and strength of the centred dipole -- and must
not be generalised.
Note the extreme, entirely spurious,
polar spot !
k)
Beware of LSD
Let us look at the effects of an error of a mere 20% in field strength
and of 10 deg in inclination.
10 lines were used instead of just 1 or 2. There are 2100 points of
a noise-free Stokes I spectrum to fit. The magnetic field was taken
into account, but instead of using the parameters shown on the plot,
the inversion was carried out with a field strength of 2000 G and an
inclination of 70o.
The rms discrepancy between input and recovered (normalised) profiles
is substantially better than 0.001, so one would expect excellent
recovery of the 3 spots. However, just 1 out of the 3 structured
spots is recovered. In exchange, we are faced with a lot of spurious
structure all over the stellar surface.
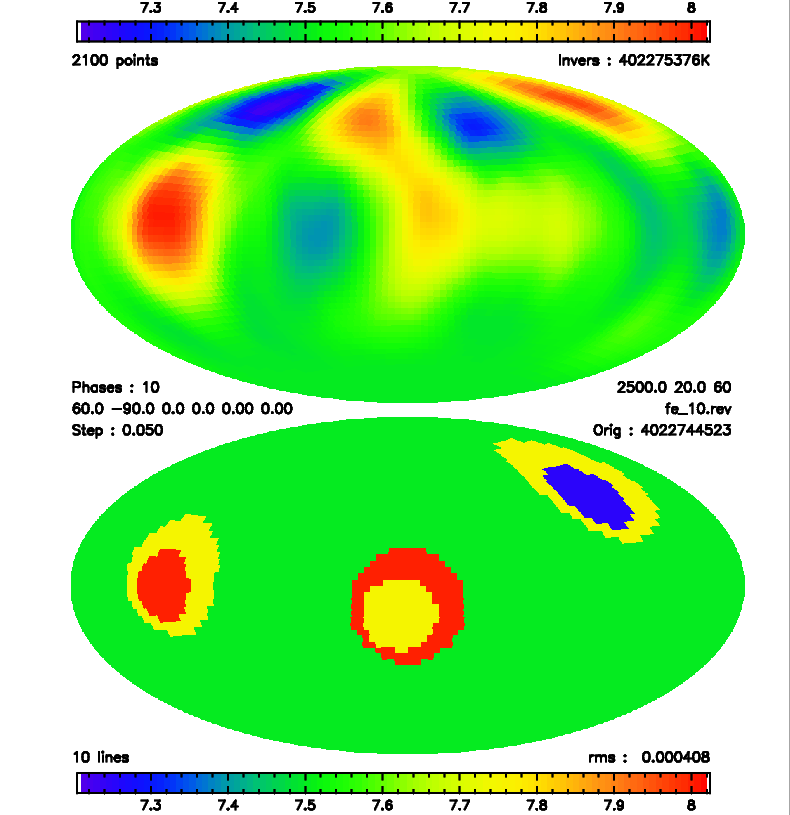
Beware of LSD, the main culprit in this example !!!!
l)
LSD based ZDM : a very special single-line inversion
Least-squares deconvolution (LSD, Donati et al. 1997) was devised for the
detection of weak magnetic signals in noisy spectra. Nothing can be said
against this field of application.
Using mean LSD profiles for ZDM (e.g. Kochukhov et al. 2014) however is
an invitation to serious trouble. In the case shown here, all stellar
parameters are exactly known. The fit to the mean profile is brilliant
but the resulting map is hogwash.
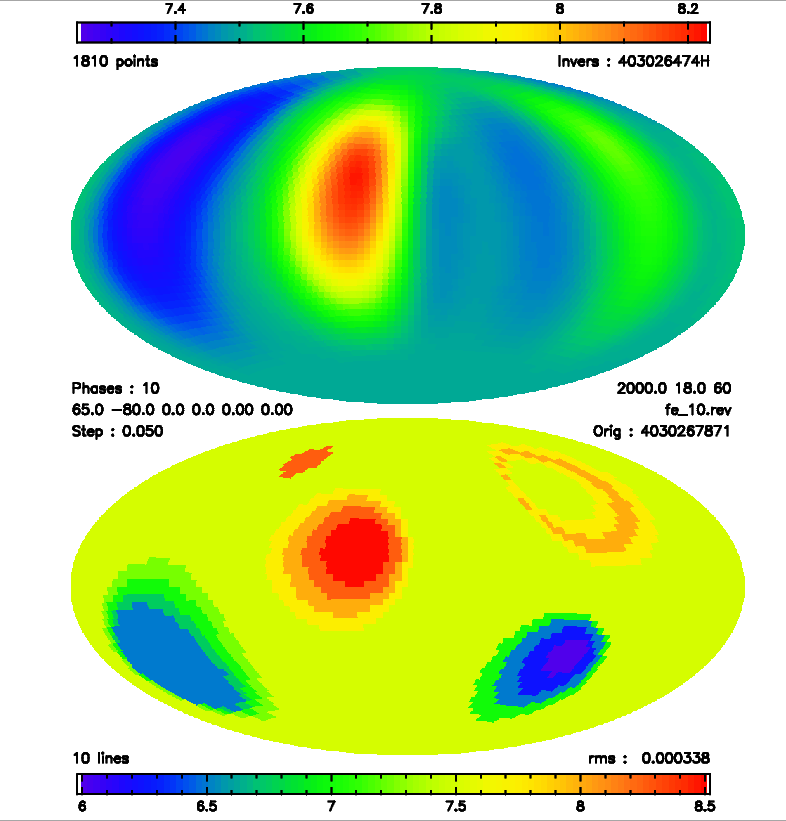
LSD based ZDM constitutes in fact a very special instance of single-line
inversions. As shown by Stift & Leone (ApJ 834, 24, 2017), one is
frequently/usually/mostly faced with multiple solutions even in the
total absence of noise. Using LSD profiles in ZDM, one drastically
lowers the observational noise, most unfortunately at the expense of the
information contained in the various spectral lines (different strengths,
Zeeman patterns, ...). Everyone even only remotely acquainted with signal
processing will be familiar with this unavoidable drawback.
m)
LSD and ZDM : increasing the number of lines, does it help ?
Let us have a look at a star featuring 5 structured spots and 1 ring-like
structure. The inversion, based solely on Stokes I, is carried out with
10, 20, 30, and 40 lines respectively.
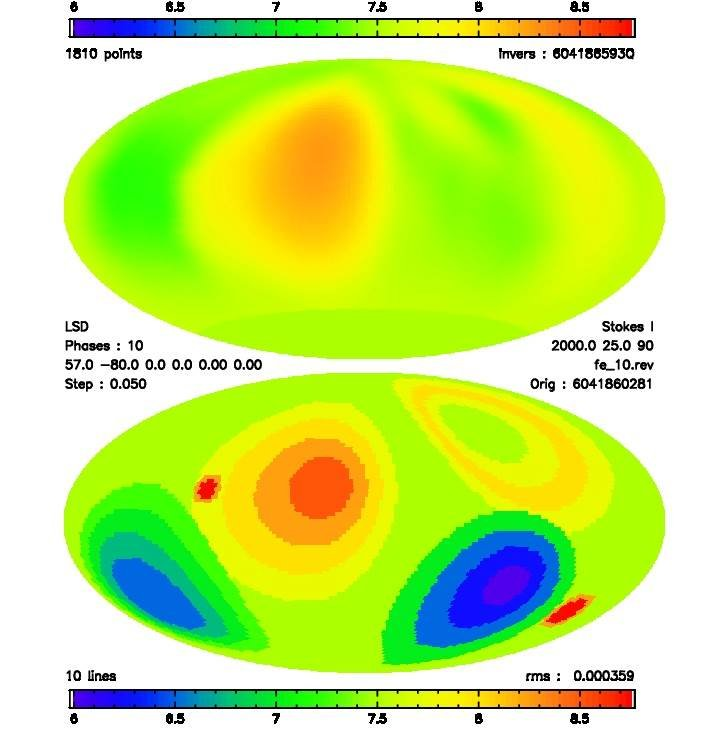
The result for 10 lines is devastating. Do things improve when more lines
are used ?
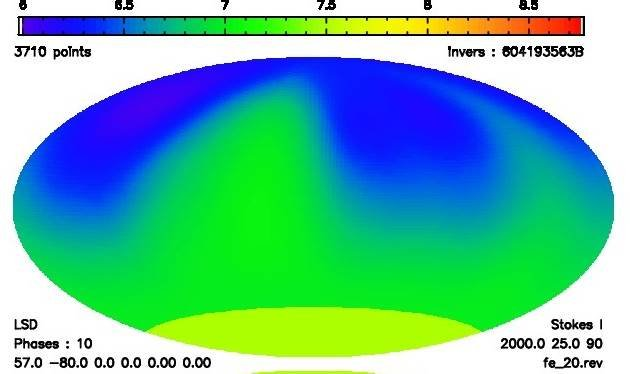
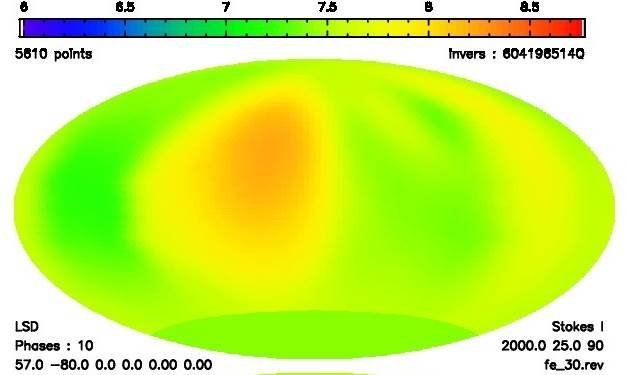
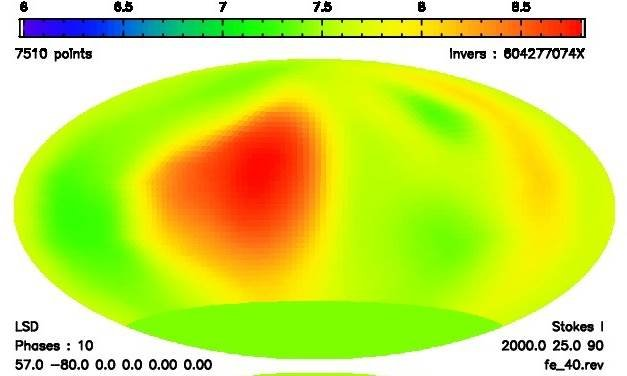
Not at all !!!
n)
LSD based ZDM : worse than usual single-line inversions
In the approach of Kochukhov et al. (A&A 565, A83, 2014) the fit is
made to mean profiles determined at each iteration step from many
individually synthesised spectral lines. It is thus not assumed that
the LSD profiles display the behaviour of a single line with some
ill-defined mean parameters.
The traditional problem of defining a single mean line is now traded
against an even less tractable problem: the code can achieve an
almost perfect fit to the mean observed profiles by summing up over
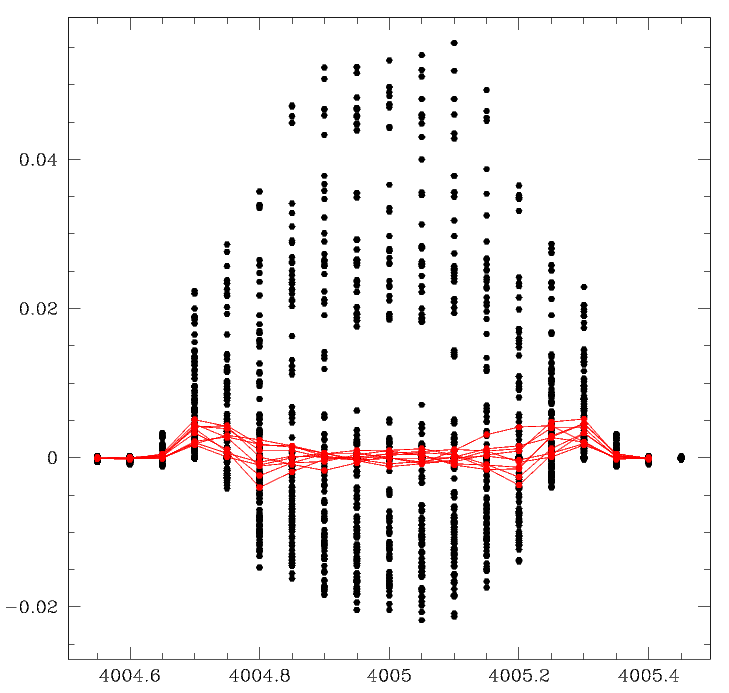
individual profiles which may all be incorrect. The plot below
illustrates the kind of numerical compensation at work (the black
dots correspond to the errors in the fits to the individual lines,
the red lines show the errors in the fits to the mean profiles). In
other words: not only are we faced with the multiple solutions
characteristic of single-line inversions, we also introduce
many additional degrees of freedom. ZDM can now more easily
converge to spurious solutions that are soundly spurious or
unphysical, but are preferred by the regularisation function.
o)
"Noise mapping" of HD50773
Deconstructing the low-contrast Ni spot on HD 50773
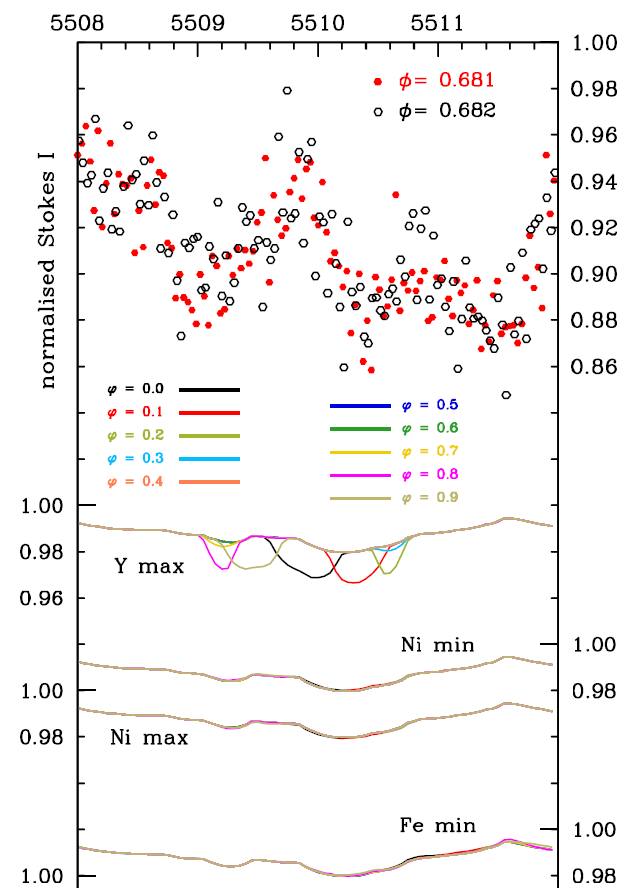
Lüftinger et al. (2010) have published a Ni map of HD 50773 from
spectra with S/N ratios ranging from 64 to 170 (mean 120). Simple
spectral line synthesis based on these Ni abundances however shews
[still archaic] that the Ni signal in the 5510 Å blend -- the Ni line
is heavily blended with Cr, Fe, and Y -- would be undetectable even
in spectra of much higher S/N ratio. Lüftinger et al. (2010) thus
have established a Ni map from photon noise and errors/uncertainties
in the Cr, Fe and Y maps. It would be incorrect to call this Ni
map spurious, imaginary or fictional being a much better
characterisation.
No spectral variations with phase are visible in the (very weak)
signals of "spots" with minimum abundances of Cu, Y, Ni, Fe, and
Cr; the signals with maximum abundances are largely swamped by
observational noise. It would appear that the admittedly
colourful HD 50773 maps which even managed to make it to
the cover of A&A are entirely fictional.
p)
An exercise in futility
In Fig. 2 of Nesvacil et al. (2012) the elemental abundances of HD3980 are
plotted relative to the sun. A number of elements exhibit a large spread in
abundances, with Si allegedly becoming as abundant as hydrogen in a
spot, O and Mn as abundant as helium. In other places, O, Si, Ca, Mn
and Fe are claimed to be under-abundant.
Basing their arguments solely on α2CVn, Kochukhov, Wade and Shulyak have
dismissed the necessity of considering local atmospheric structure due to
high elemental abundances in
http://adsabs.harvard.edu/abs/2012MNRAS.421.3004K
Still, their Fig. 9 leaves no doubt as to the effects
of local abundances
on the atmospheric structure and on the resulting maps for Fe (differences
range from -0.8 dex to +0.7 dex).
These findings are of course not entirely new, having been explored by
Chandrasekhar as early as 1935. Coming to Nesvacil et al. (2012) and her
co-authors -- D. Shulyak in particular -- one must not overlook
http://adsabs.harvard.edu/abs/2007A%26A...469.1083K
where Khan and Shulyak have established the importance of the Si abundance
for the atmospheric temperature structure for up to a +3 dex over-abundance
(Fig. 1 and discussion in subsection 3.1.5. Large ( > 3%) changes: Si,
Cr, Fe and [M/H])
Now let us listen to what Nesvacil et al. (2012) have to say.
Quote :
"For further analysis LLmodels model atmospheres (Shulyak et al. 2004)
were considered a more appropriate choice for a star with a rather complex
abundance pattern such as for HD 3980. The LLmodels code was used to
construct a final model atmosphere with the individual abundances presented
in Fig. 2. If elements were found to be inhomogeneously distributed across
the stellar surface, average homogeneous abundance values were implemented
in the model atmosphere calculations."
Their Fig. 2 reveals that the mean abundances of Mg, Si, Cr and Fe are only
~1 dex, that of Cr ~2.5 dex and of Mn ~2 dex above solar. In some spots
however, Si is claimed to become over-abundant by ~4 dex, O by ~2 dex, Cr
by ~4 dex and Mn by > 5 dex. The effects of these fabulous over-abundances
should be absolutely striking, but amazingly Nesvacil et al. chose to
consider it "luxury" to use local atmospheres in the DM analysis, quite
at variance with the "necessity" to use LL models based
on mean abundances
applied indiscriminately all over the star, from regions depleted in O, Si,
Ca and Fe to spots where metals allegedly dominate hydrogen and/or helium.
As a result of these assumptions, the O spots (+2 dex) were modelled with
an atmosphere where O is assumed -0.5 dex solar. the Si spots (+4 dex) with
an assumed +1 dex solar, the Mn spots (+5.5 dex) with an assumed +2 dex
solar.
You cannot possibly call this approach internally consistent, but
certainly unphysical (as explained in another section) !
q)
Magnetic maps and magnetic pressure
At phase 0.60 (Piskunov, Phys.Scr. 2008, Fig. 3), field strengths over
the visible hemisphere differ by a factor of ≥ 5. This translates to
a factor of ≥ 25 in magnetic pressure.
A patch with field < 7 kG and another patch in its immediate vicinity
with ~19 kG are found along the magnetic equator (horizontal field
lines) ==> ~ 7-fold difference between (high) magnetic pressures
within a distance of only ~300 .
In the absence of strong vertical magnetic fields, what/where is the
stabilising force for horizontal equilibrium ?
Also have a close look at Fig. 1 of Silvester et al. (2014). At phase
0.60 you behold an elongated magnetic "spot", bordering a region with
almost zero field. The gradient in field strength is impressive :
within some 30o the field strength drops from about 5 kG to almost
zero. Inexplicably, this is accompanied by a largely dipolar field
direction, the magnetic equator (horizontal field lines) being
aligned with the southern border of the "spot".
Again, have these authors (or their referees) ever spent a thought on
magnetic pressure and how horizontal equilibrium could be established
under these conditions ?
r)
Horizontal equilibrium ?
The Mn, Si and O „spots“ on HD3980: what a leading expert in the field
of stellar atmospheres has to say.
Dear Martin,
... the present case, where the abundance of Si and other species go
to 1 relative to hydrogen, seems to be absurd. .... if one constructs
a model atmosphere for the ambient atmosphere and for the patch, the
latter would have 10 or more time less geometrical height corresponding
to the given column mass. I cannot imagine how such a structure would
survive.
The mean molecular weights in two “cylinders” (with solar Fe abundance
and 3 dex vertically constant overabundance) on a spotted star differ
by a factor of ~2.5. The corresponding pressure scale heights imply
horizontal pressure differences between the “cylinders” reaching several
orders of magnitude.
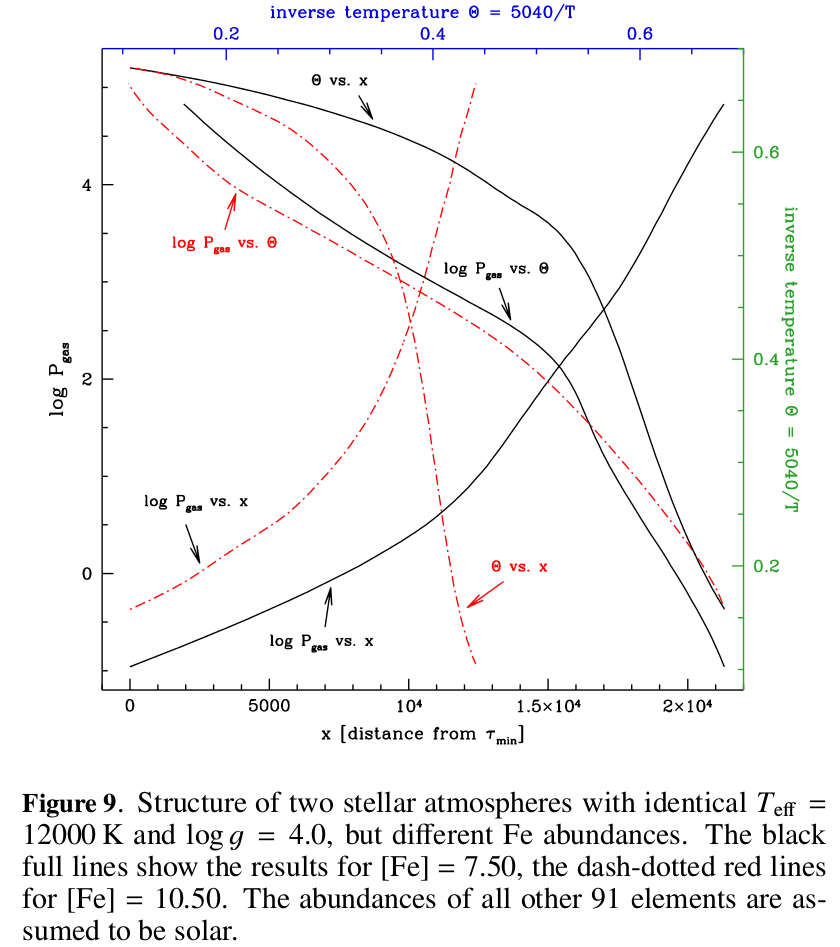
Sending this plot to the leading expert I wrote : For this purpose I
have taken two Atlas12 atmospheres with T_eff = 12000K, log g = 4.0,
one with Fe = 7.50 (where H = 12.00) and the other with Fe = 10.50.
The mean molecular weight in the first case is 1.26, in the second
case 2.81 (remember that in the spots claimed by Nesvacil et al. 2012
it would be ~15). The plot shows
a) log P gas vs. z
b) log P gas vs. theta
c) theta vs. z
The leading expert again :
Dear Martin,
I must say I agree with virtually everything you say. Your plot nicely
demonstrates what I tried to express verbally
HR3831 is less extreme but pressure differences are still large
despite the relatively modest maximum difference in mean molecular
weight in any two “cylinders”.
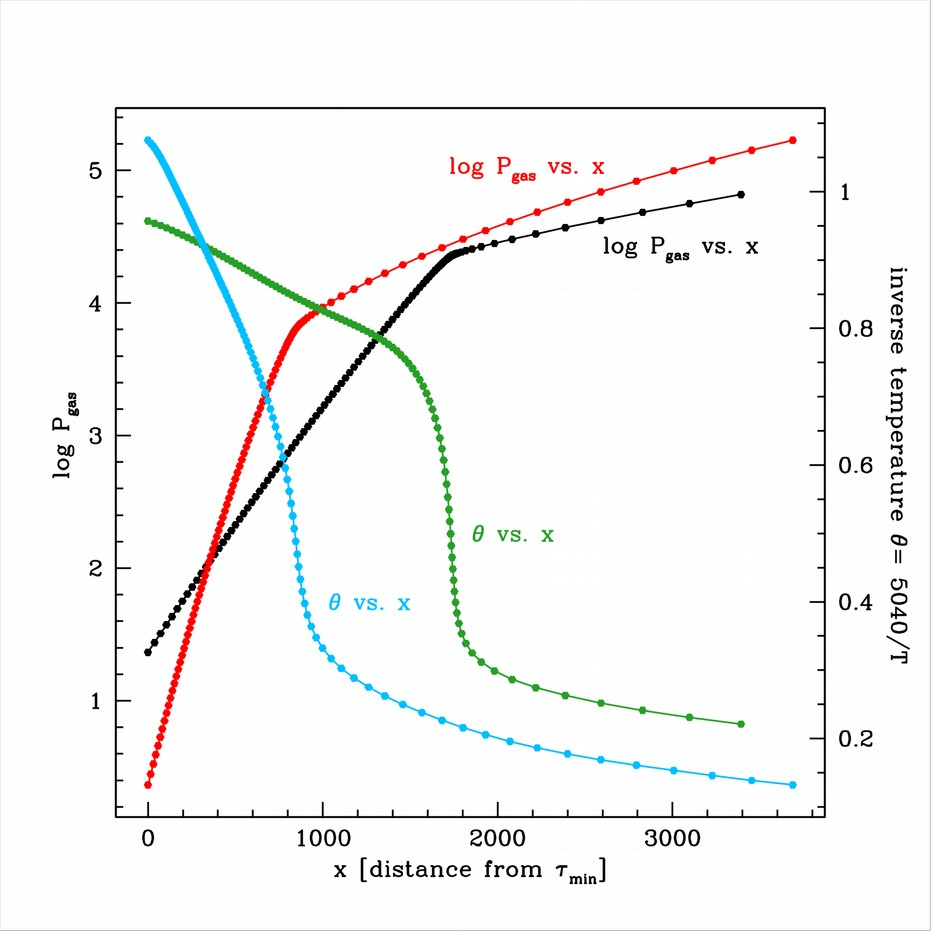
The corresponding pressure scale heights imply horizontal pressure
differences between the “cylinders”, reaching up to 1 dex.
s)
The spots in HD3980 from a terrestrial perspective
The pressure scale height on earth is ~8 km, the height of Chomolungma,
earth’s highest mountain. Taking the local atmospheres in the O, Si,
and Mn “spots” claimed for HD3980 and putting them in relation to an
atmosphere with solar abundances, one finds that the pressure on top
of Mt. Errigal (Donegal, 751m) would equal the pressure on top of
Chomolungma.
Just try to imagine a PhD student in meteorology or geophysics working
on aerial photographs of a mountainous region, taken at different times
and at different angles. By some more or less sophisticated method this
student finds that the pressure on top of a mountain the height of
Chomolungma
(Mt. Everest) is just sufficient for a human being to survive.
By the same method the student realises that around a nearby mountain the
height of Snowdon,
the atmosphere consists of pure Xenon, leading to a
pressure at the top of this mountain about equal to that on top of
Chomolungma. Strangely enough, despite the moderate distance between
these two fascinating mountains, the horizontal differences in pressure
miraculously continue to persist, there is no air flow at all between
the two regions, no mixing of the gases.
The PhD student and her supervisor from a far-away university, thrilled
by their discovery, decide to submit the results to a peer-reviewed
journal, offering no explanation for these strange atmospheric physics.
The fact that the huge horizontal differences in pressure seem to
remain stable (at least over the epoch of the observations) is imputed
to some unknown mechanism that meteorological and geophysical theory
have yet failed to unearth. The empirical results -- claimed to "provide
important observational constraints for modelling" but never put to any
of serious scrutiny in the submitted paper -- are at the basis of the
statement "This all suggests that important details are missing from
the theory relating to the formation of horizontal structures".
Would such a paper ever be published in meteorological or geophysical
real life? Would these people ever get funding for further work in
this field? How then is it possible that in
astrophysics results
derived by means of an insane method of empirical analysis can
triumph over well-founded theoretical knowledge built up over
decades and centuries by great theoreticians, including a
Nobel price laureate ?
t)
It can become even weirder !
According to Ryabchikova et al. (1996) κ Psc is characterised by
T_eff = 9250K, log g = 3.75, i = 35o , P = 1.418 d
The Cr abundance varies between -6.08 and -3.42
according to Piskunov et al. (1998) κ Psc is characterised by
T_eff = 9250K, log g = 4.50, i = 70o (!?), P = 1.409582 d
The Cr abundance varies between -6.09 and +0.27
The pressure scale height in the Cr “spot” claimed by Piskunov would
be at least 30 times smaller than in the rest of the atmosphere !
How could such a configuration ever be stabilised by the weak
magnetic field ?
Looking at Piskunov’s Cr “spot” from a terrestrial perspective, one
finds that the pressure on top of Heaval (Barra, Outer Hebrides, 383m)
would lie below the pressure on top of Chomolungma. Would anyone be
prepared to believe that these mountains would maintain gigantic
pressure differences over thousands of years, whether standing close
to each other or separated by whole continents ?!
u)
Unphysical regularisation functions
A singularly unphysical regularisation function can be found in the
Rusomarov thesis.
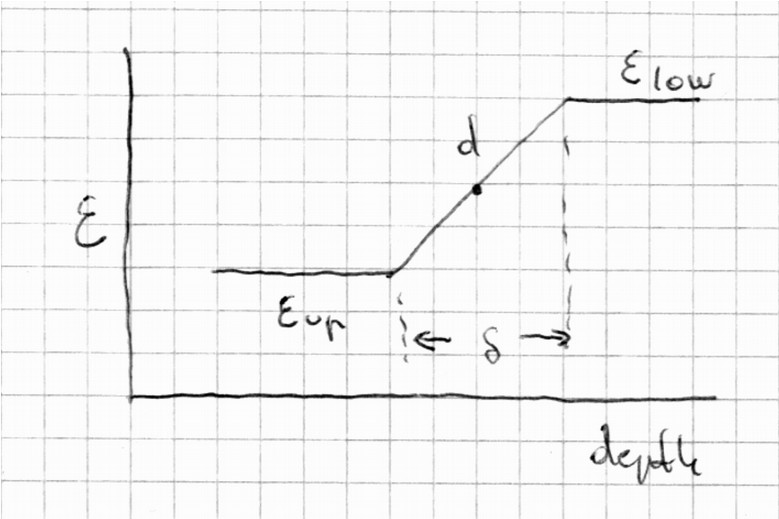
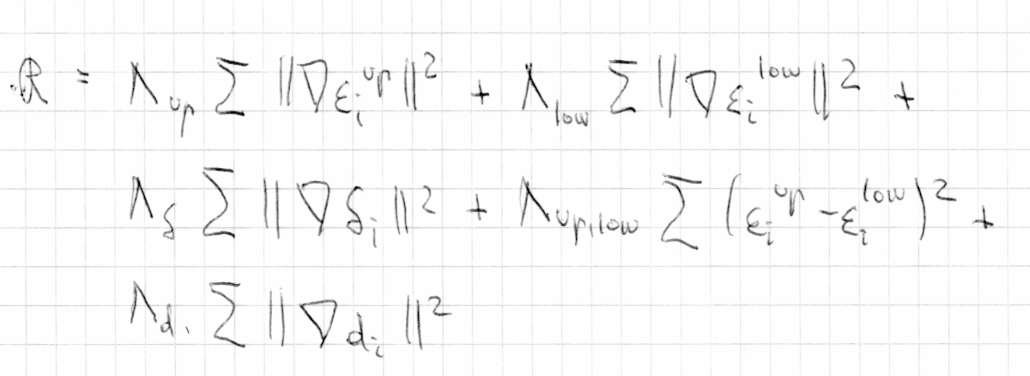
There are 4 parameters defining the stratification profile,
viz. the (constant) abundance ε(up) high up in the atmosphere,
the (constant) abundance ε(low) deep in the atmosphere, the
position d and width δ of the transition region. The penalty
function minimises the sums -- over all combinations of points
on the stellar surface -- of the differences between the local
values of ε(up), ε(low), d and δ. In this approach
not only are
the individual values of ε(up) and ε(low) supposed to vary as
little as possible over the star, the same is thought to hold
for the positions and the widths of the local transition regions.
These assumptions are topped by the requirement of minimum
variation of the local differences between ε(up) and ε(low).
This regularisation function is oblivious of the entire
literature on atomic diffusion; it runs counter to what
we know from theory and solar observations on the influence
of magnetic fields on the movement of charged particles.
It is not based on any alternative to atomic diffusion
nor on any (astro)physical considerations at all, just on
computational convenience.
But quote Rusomarov :
"... we developed the first 3D Doppler imaging method that can
recover the full 3D abundance distribution of a chemical element
in the atmospheres of Ap stars.”
"We discovered a strong correlation between the surface abundance
derived with 2D magnetic Doppler imaging and vertical stratification
of Fe: higher surface abundance corresponds to a transition region
that occurs higher in the atmosphere and vice versa.”
Not only have all the results on atomic diffusion accumulated over
almost half a century been disregarded, Rusomarov has not even
found it necessary to carry out simulations which would demonstrate
that his algorithm is capable of recovering 3D stratification maps,
complex or not.
The whole 3D analysis being thus devoid of any
meaning, one cannot be surprised that the 3rd (and central)
part of the thesis has never been accepted by A&A or
published in any other journal, refereed or not.
v)
Equilibrium solutions and pseudo-rings
Equilibrium stratifications in a star with the field geometry of
HD154708 (Alecian & Stift, MNRAS 468, 1023, 2017). Stift‘s excentric
tilted dipole model leads to warped pseudo-rings characterised by
changes in contrast with optical depth and with longitude.
The field strengths in this model range from 7 to 17 kG.

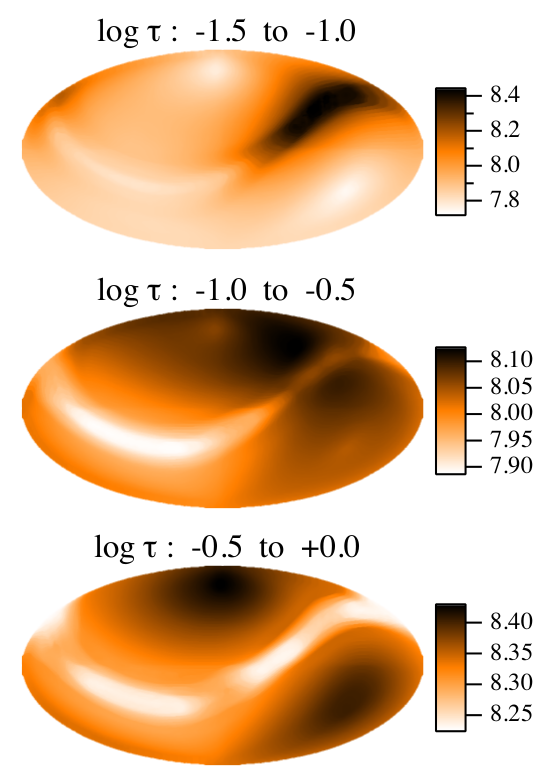
These results make it clear : there is no such thing as a globally
constant stratification profile in magnetic stars.
This plot dispels the myth of “razor-sharp
overabundance rings
predicted by the current diffusion calculations”
(quote Kochukhov).
w)
Time-dependent atomic diffusion and mass loss
Non-magnetic and magnetic stationary solutions to the time-
dependent atomic diffusion problem.
Results for a star with T_eff = 13450 K, log g = 4.30.
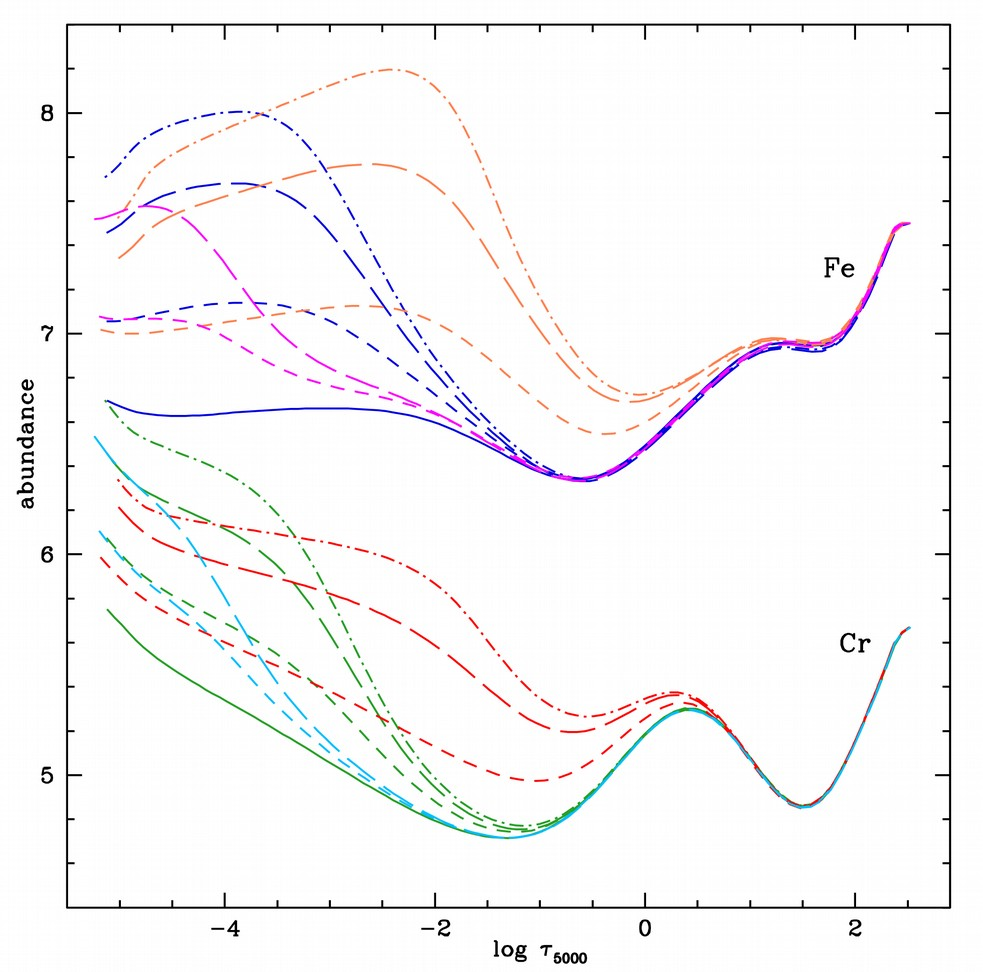
The effect of the magnetic field strongly increases with the
angle relative to the surface normal (45o, 60o,
65o)
Full lines : non-magnetic case
From right to left : 10000 G, 1000 G, 200 G
Note : In this scheme, abundances are kept constant at the bottom.
Equilibrium or stationary solutions, there is no way
to produce globally constant stratification profiles
in magnetic stars.
According to extensive numerical simulations by Alecian & Stift
(2018), mass-loss strongly modifies the stratification profiles.
x)
Do spots and magnetic features really rotate differentially ?
Look closely at Fig.4 of Piskunov (Phys Scr. T133, 2008). Isn't it
amazing that abundance spots are slowly drifting over the stellar
surface? Take e.g. the small Ca "spot" shown at phases 0.40, 0.60 and
0.80 which rotates differentially, slower than the star. At phase 0.40
the "spot" lies between 2 meridians, at phase 0.80 it is bisected by
a meridian. At the same phases, the edge of the Si "spot" first lies
between 2 meridians, only to become aligned with the meridian. Ti, Fe,
and Nd are exhibiting the same mysterious drift.
Strangely enough, these exciting findings have not been commented upon
by Piskunov. May we mention that in the original paper on 53 Cam by
Kochukhov et al. (A&A 414, 613, 2004) a similar drift of the "spots",
but also of magnetic features went unnoticed ! Fig. 5 a-c and Fig. 10
clearly reveal moving magnetic "spots". Fig. 6 is unequivocal as far
as the drift of the Fe "spots" is concerned.
One may well be also surprised by the 3-spot test presented by Kochukhov
on p. 39 of "Surface cartography of the Sun and stars" (Besancon, 2014).
Why on earth has this very conspicuous drift of the spots not been
mentioned by Kochukhov & Piskunov (2002)? What an enigma, why have they
adopted moving spots?
y)
Spatial super-resolution with Invers10 ?
The referee of "Doppler imaging of chemical spots on magnetic Ap/Bp stars"
(A&A 597, A58, 2017), carefully chosen by Astronomy and Astrophysics, has
expressed, among others, her/his appreciation of the introduction which
"sets this work properly into context and provide the reader with all
necessary information." She/he has also been particularly pleased by the
fact that "the numerical experiments and
simulation as well as the results
are clearly described and presented" (citation courtesy O. Kochukhov).
Is it possible that the referee has overlooked at least one description
that appears to be incompatible with virtually all the plots in this
article? Could it be the case that the reader is not provided with the
necessary information?
It says at the end of section 3.1: "Chemical
abundance maps were recovered
using a 1876-element surface grid with variable number of zones in 38
latitude belts" (see Fig. 5 in Piskunov & Kochukhov (2002) for an example
of such a surface grid)." Figs. 3 to 11 however show something completely
different!! There is no sign of this low-resolution grid in the uncannily
smooth recovered maps. On a 2034-element grid the 4 spots adopted by
Kochukhov would look like that :
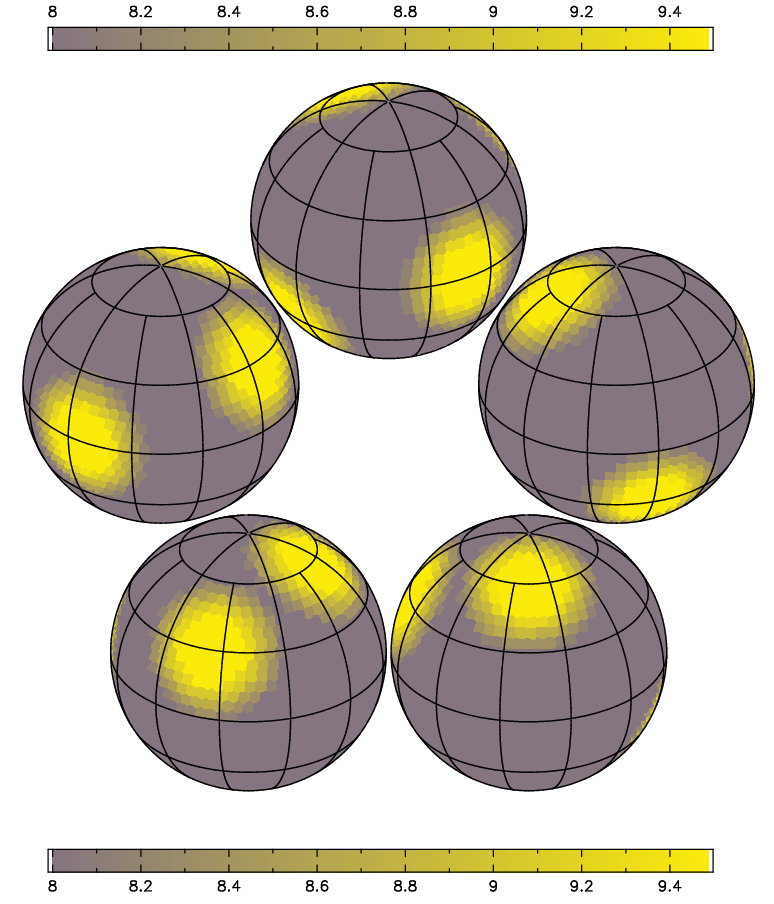
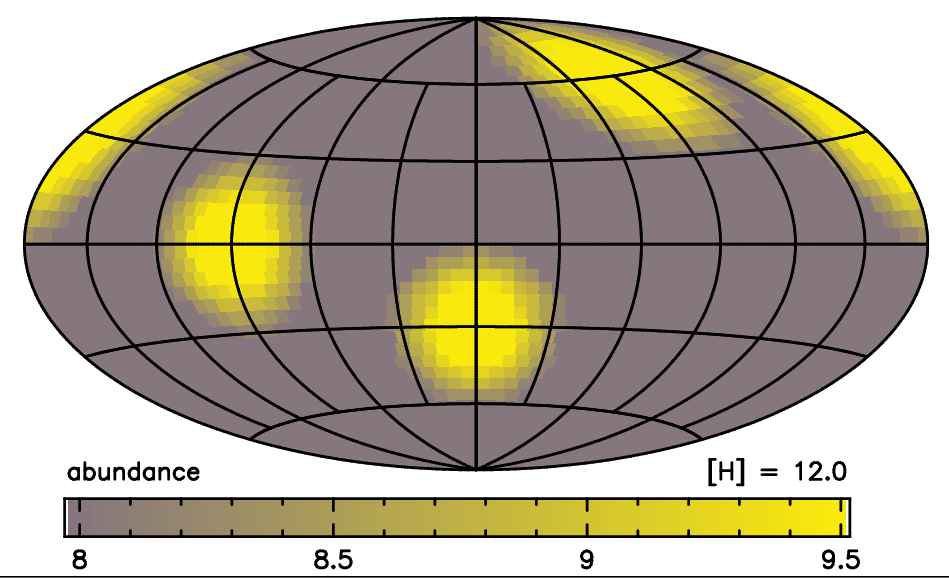
Has Oleg Kochukhov really achieved spatial super-resolution
with his Invers10 code?
Of course not, but nothing is said in the article about the smoothing
algorithm(s) applied to the 1876-element results although IDL surely
offers a plethora of possibilities. Shouldn't the reader be entitled
to know the errors in the sense recovered minus original
before
smoothing as compared to after
smoothing ?
If smoothing is an essential ingredient to the numerical tests, one
begins to understand the importance of adopting spots with an "umbra",
surrounded by a "penumbra" (quote O.K.: "The
element abundance was
linearly interpolated between rin and rout,
resulting in smooth spot
edges"). With sharp edges as in the tests presented in 2002, smoothing
would hardly be of help but rather finish in embarrassment. There is
an additional "advantage" to the new, structured spots: from Fig.5 of
Kochukhov & Piskunov (2002) it is obvious that monolithic spots are
very extended in the sense that dozens of degrees away from the
original position you still find non-negligible over-abundances as
discussed by Stift & Leone (2017). Virtually nothing of this kind can
occur in the new scenario thanks to the smooth edges of the original
spots and thanks to smoothing of the recovered map.
z)
Conclusions
We have seen that
1) chemical stratifications in CP stars are predicted by theory to
depend on magnetic field angle and field strength;
2) this dependence shows up for fields ranging from strong to quite
moderate as quantified by detailed numerical modelling;
3) mass-loss can considerably modify these stratifications;
4) there can thus be no such thing as a global stratification profile
in magnetic CP stars;
5) horizontally varying unstratified abundances are definitely
incompatible with pressure equilibrium;
6) ZDM inversions based on abundances that vary horizontally but are
kept constant with depth must therefore be doomed.
We have demonstrated that
1) the numerical tests of the ZDM algorithm presented by Kochukhov
(and Piskunov) are hopelessly inadequate in the face of the
complex magnetic and abundance maps claimed by the same authors;
2) their error estimates for the recovery of abundance maps are highly
unrealistic;
3) neglecting a magnetic field in the DM analysis can result in errors
much in excess of those given by Kochukhov for a singularly
artificial case;
4) neglecting a magnetic field in a DM analysis can yield spectacular
spurious abundance structure;
5) mean stellar atmospheres used instead of "true" local atmospheres
lead to spurious maps;
6) LSD profiles are unsuited for DM or ZDM analyses, introducing an
excessive number of additional degrees of freedom which will often
(almost always?) result in spurious maps;
7) the published abundance maps of several elements in HD 50773 are
purely fictional, the observational noise swamping the spectral
variations;
8) the extreme spots claimed for HD3980 are completely unphysical,
being incompatible with basic stellar atmospheric physics (huge
differences in the respective local pressure scale heights);
9) most magnetic maps published so far are not force-free (as they
would have to be in view of the strong magnetic fields).
The situation is without hope for ZDM of magnetic CP stars since
1) it is impossible to determine local stratification profiles for
each position on the stellar surface without adopting an
appropriate, astrophysically motivated regularisation function;
2) not a single regularisation function formulated so far reflects
the complex physical reality, least of all the function proposed
by Rusomarov in his thesis;
3) ZDM solutions cannot be constrained by parameterisation (not only
do stratifications depend on magnetic field strength and angle,
but mass-loss also probably depends in an as yet unspecified way
on the magnetic field);
4) parameterisation is made impossible by the fact that horizontal
pressure equilibrium between chemical spots and their surroundings
constitutes a 3D problem that cannot be solved at present nor in
the foreseeable future.
ZDM of magnetic CP stars will remain a highway to perdition.
 Back to the Ada in Astrophysics Homepage
![]()
 a) Un "paradis artificiel"
  b) What Kochukhov and coworkers claim to have found in real Cp stars
 c) HR 3831 vs. "artificial paradise"
 d) Most magnetic maps are spurious, either leading to div B ≠ 0
 e) Redefining the meaning of the word “confirm“
 f) New data → new maps forever ?
 g) Same element, same data set, same code
 h) Ignoring the magnetic field of a spotless star
 i) Ignoring the magnetic field of a "paradisiacal" spotted star
  j) No spurious spots produced when mean atmospheres are used ?
 k) Beware of LSD
 l) LSD based ZDM : a very special single-line inversion
 m) LSD and ZDM : increasing the number of lines, does it help ?
 n) LSD based ZDM : worse than usual single-line inversions
 o) "Noise mapping" of HD50773
 p) An exercise in futility
 q) Magnetic maps and magnetic pressure
 r) Horizontal equilibrium ?
 s) The spots in HD3980 from a terrestrial perspective
  t) It can become even weirder !
 u) Unphysical regularisation functions
 v) Equilibrium solutions and pseudo-rings
 w) Time-dependent atomic diffusion and mass loss
 x) Do spots and magnetic features really rotate differentially ?
 y) Spatial super-resolution with Invers10 ?
 z) Conclusions


 Back to the Ada in Astrophysics Homepage